Over the last decade, ecommerce stores owners have become increasingly accomplished at judging the ROI of their acquisition funnels. However, what comes after a customer goes through a well-oiled and perfectly optimized funnel, is, for the most part, still a world of unexplored data. How on earth do we measure this data in order to make it actionable? Mastering the customer journey post-acquisition will create the ecommerce winners of the next decade.
Purchase frequency is the average number of times a customer buys from a store during a given period and is a good indicator of the sustainability of a business and the effectiveness of its retention marketing. This is even more important when you know that bad retention is the main bankruptcy cause for ecommerce stores.
If you’re wondering how your purchase frequency performance is compared to other retailers in your industry or what your retention rate should be, then you will find this report helpful. We took in data from almost 500 small and medium-sized retailers so that you can benchmark your purchase frequency against that of your ecommerce peers.
Infographic
The research has been summarized in the Ecommerce Purchase Frequency Infographic.
Methodology
Purpose of study
- To create reliable and up-to-date purchase frequency benchmarks for e-commerce retailers to use in 2017.
- To detail how retailers can improve their loyalty and the purchase frequency of their customers.
Definitions and Calculation Methods
- Loyal customers: Customers who have bought from the store more than once.
- Percentage of loyal customers: The number of customers who bought from the store more than once divided by the total number of customers the store has had.
- Purchase frequency: How many times a customer buys from the store in a given year. This is calculated by averaging the intervals between purchases from the same customer and then dividing 365 by this number. Taking a simple example, a store with loyal customers who buy on average every 73 days would return a purchase frequency of 5 (365/73).
The sample
- The sample includes 495 retailers
- The stores’ orders come to a combined total of 2.6 million orders from 1.6 million customers.
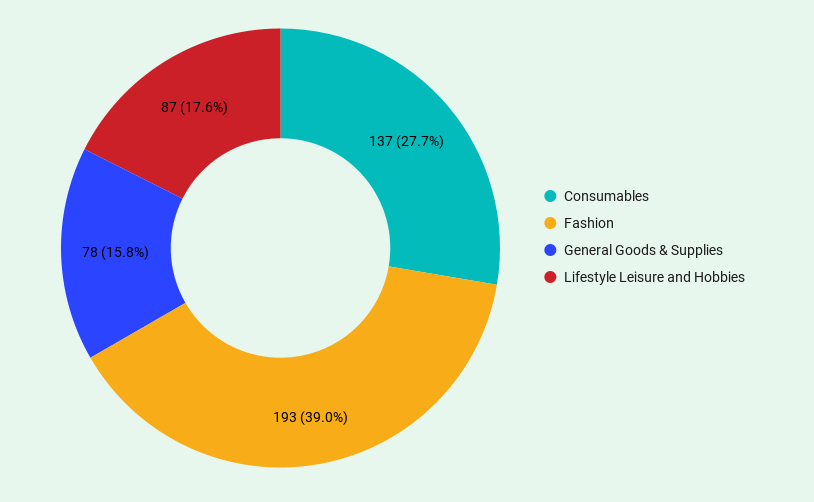
- The sample was categorized into 19 major categories and which were then attributed to 4 different industries: Fashion, Consumables, Interests and Hobbies, and General Goods.
Consumables: This industry includes packaged products that are consumed relatively regularly and quickly.
No. of stores: 137
Categories:
- Food
- Health and nutrition
- Beauty and cosmetics
- Men’s grooming
- Vaping e-cig
Fashion: This industry includes any worn items such as apparel, jewelry, mother and baby as well as accessories.
No. of stores: 193
Categories:
- Apparel
- Jewelry
- Mother and baby
Interests and hobbies: This industry includes categories related to personal interests or hobbies.
No. of stores: 110
- Toys and hobbies
- Sport
- Collectibles
- Books, music, and education
General Goods: This industry is an aggregate of remaining stores.
No. of stores: 78
- Electronics General Goods
- General Goods Stores
- Home & Leisure
- Party & Special Occasions
- Stationery and Office Supplies
Data integrity and limitations
- The sample is representative of small and medium-sized online shops and takes into consideration shops with between 1500 customers and 200,000 customers.
- We were only able to access data related to customers who had store accounts which means the number of total customers is likely to be higher than stated.
- Although most categories are well represented in the study the following ones have less than 10 stores: Adult, Men’s Grooming, Books Music & Education, Stationery & Office Supplies, Party & Special Occasions.
- In order to prevent smaller samples from affecting the data at the industry level, we used weighted averages.
- Links to the original data are available at the bottom of the page.
Analysis of ecommerce loyalty
Generally, the costs associated with selling to a retained customer are much lower than those associated with selling to a new customer. So naturally, having more loyal customers reduces the cost of sales, and makes ecommerce businesses more sustainable in the long term. Moreover, it has been shown that loyal customers are more likely to become brand advocates, and directly refer your business to friends. In our study, a loyal customer is taken as any customer who buys from your store more than once.
Customer loyalty by industry
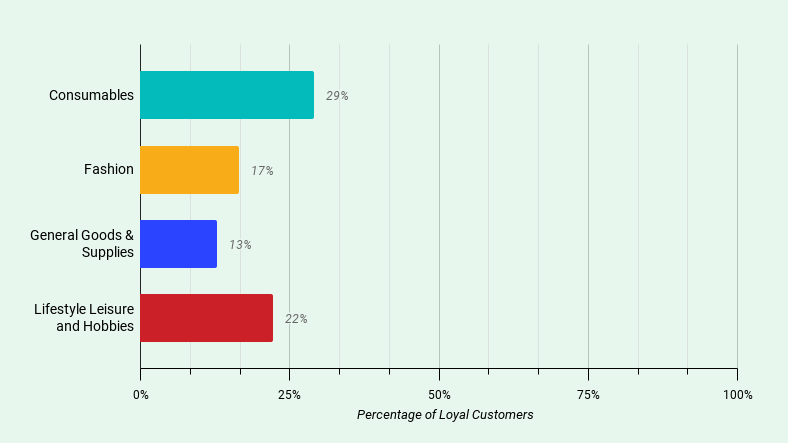
The above graph tells us what percentage of customers in each industry come back and shop in the same e-commerce store more than once. The considerably high range – consumables is almost double Fashion and General Goods – demonstrates that customer loyalty varies considerably depending on the industry.
The consumables industry (29%) manages to hold onto far more customers than the Fashion and General Goods industries (both 16%). This difference can largely be explained by the nature of the goods in each industry. Consumables have, by their nature, a relatively high likelihood of repeat purchase. On the other hand, General Goods and Fashion products tend to have a much longer lifespan, making repeat purchases less likely. The interests and hobbies industry lies somewhere in the middle ground. While these products have a similarly long lifespan to Fashion and General Goods, the higher purchase frequency can likely be explained by the fact that purchases in the industry are driven by passion.
Customer loyalty by category
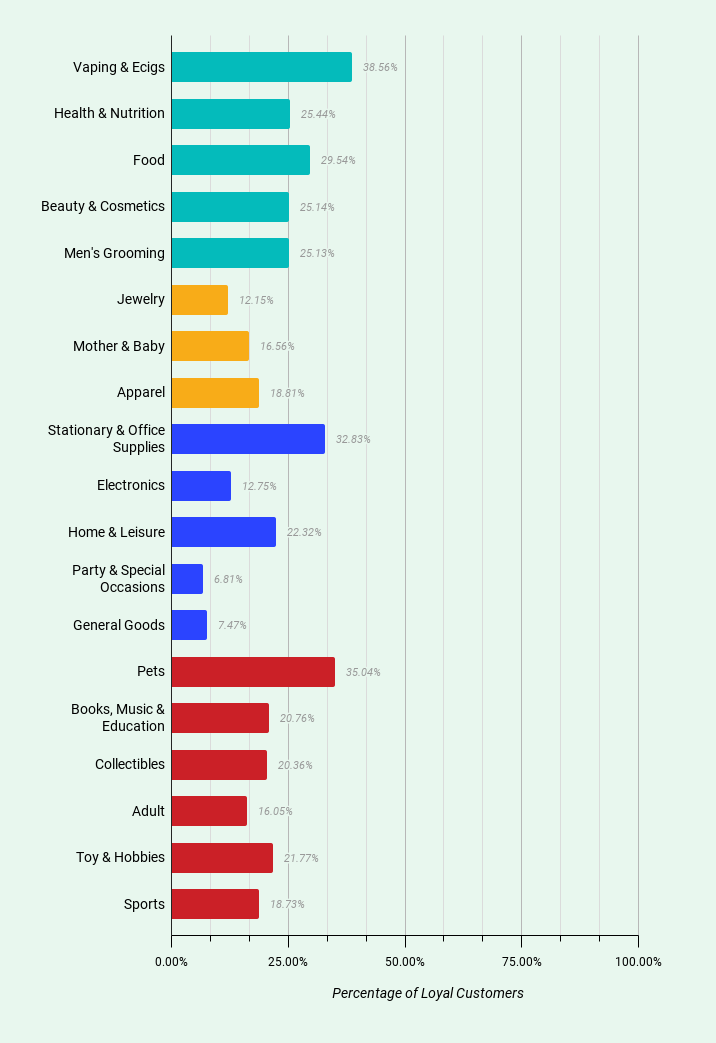
The above graph tells us what percentage of customers in each category come back and shop in the same e-commerce store more than once. As we’d expect from the large range observed in the industry analysis, there are some big winners and losers in loyalty across categories. Acquisition dollars go far in Stationery & Office Supplies, Vaping & Ecigs, and Pets, with between 33% and 39% of customers coming back again after their first purchase in these categories, while General Goods Stores and Party and Special Occasions both have the lowest percentage of customers staying around with 7%.
Analysis of ecommerce purchase frequency
Purchase frequency is the number of times a customer buys from an e-shop in a given period. It is an integral variable in calculating an online store customer lifetime value. In our study, the purchase frequency is considered over a period of 1 year. The ideal situation for a retailer is to have both a high purchase frequency and high customer loyalty so that they can extract the most value possible from customers.
Purchase frequency by industry
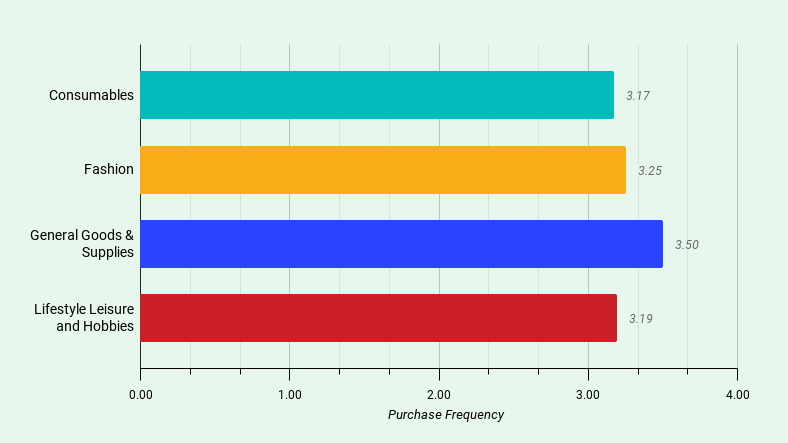
The above graph tells us how many times loyal customers in each industry come back and buy from the same shop during a period of one year. What we can observe is that there is a very low standard of deviation in the data, and customers buy between 3 and 4 times per year regardless of the industry they’re buying in. This uniformity, suggests that e-commerce shoppers have established buying patterns that are based on periodical needs.
Purchase frequency by category
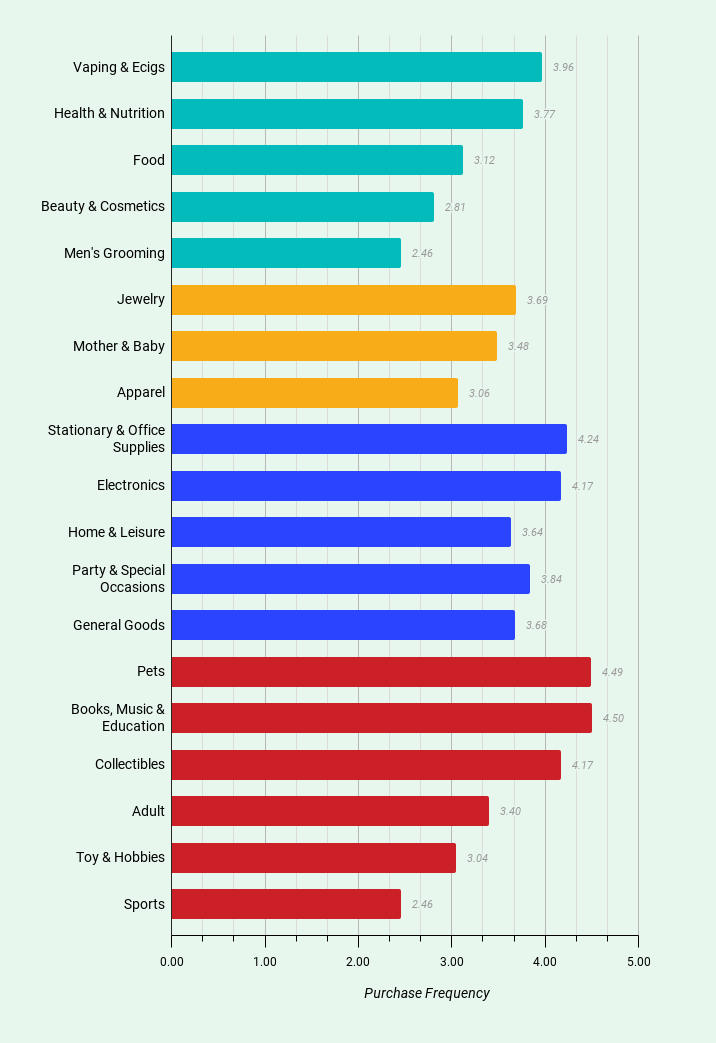
The above graph tells us how many times loyal customers in each category come back and buy from the same shop during a period of one year. Across all categories, the minimum amount of times a loyal customer will buy during a period of one year is above 2.41 and the maximum is 4.5, while the average is 3.58. Loyal customers in the Books, Music & Education, and Pets categories, appear to be exceptionally loyal and come back to buy 4.5 times on average in a single year. At the other end of the scale, categories that have a low purchase frequency are Sports, men’s Grooming (both 2.46), and Beauty and Cosmetics (2.81).
Conclusions from the analysis of loyalty and purchase frequency
The purchase frequency analysis demonstrates that across industries customer buying patterns are quite similar, with customers tending to buy between 3 and 4 times per year. On the other hand, the percentage of loyal customers per industry varies considerably from 16% to 29%.
What we expected, before analyzing the data was to see a correlation between loyalty and purchase frequency, however, the data doesn’t suggest. However, whether based on needs or convenience, the buying habits of customers appear to be quite fixed. This presents interesting opportunities for retailers because if they manage to entice a customer to buy again after their first purchase, that customer is likely to make multiple follow-up purchases. Therefore, encouraging the first repeat purchase is vital and where retailers' efforts and resources are likely to yield the most return. Secondly, retailers should seek to optimize the purchase frequency of customers who fall below 4 to 5 purchases per year, while working to drive sales from customers who have already reached this point is unlikely to bring as big a payoff.
It should be noted that the Average Order Value has not been taken into consideration, and could present another helpful lever for retailers in increasing their revenue from retained customers.
The most attractive categories according to loyalty and customer frequency.
The online pet market in America alone was estimated to be at $324 million in 2015 and has continued to grow. The data from this study emphasizes both the attractiveness and sustainability of this industry; acquisition dollars go a long way in this category, with 35% of customers coming back and buying from the same store an average of 4.5 times per year.
Vaping & Ecigs
The rise of the Vaping & Ecigs category in recent years has been meteoric, and today it’s valued at $4.4 billion in the U.S. alone. In the face of increasing legislation regulating the industry, Vaping & Ecigs retailers are doing a great job at retaining their customers; 39% of customers in the category purchase more than once, buying four times during a year.
How to increase purchase frequency and loyalty
Quick Shipping is the key to a customer’s heart
According to Microsoft, 66% of US consumers say they’ll spend more money with companies that offer excellent customer service. There are many factors that contribute to poor retention. When it comes to online shopping one of the key factors in determining a positive customer experience is the speed of delivery. In a recent Greenfield Online Survey, 60% of online shoppers cited this as a leading factor of great customer service. In shipping, hours can make a difference between getting a product shipped a day earlier or a day later. Retailers should seek to optimize internal processes to get products to ship on the same day, while any external communication should be automated where possible to make it instantaneous.
Simple rewards programs make customers buy more
According to Rosetta, customers that are actively engaged with brands and their loyalty programs are five times more likely to indicate it is the only brand they would purchase in the future. Although there’s a temptation among many retailers to try to have fanciful feature lists for rewards programs, simplicity is the key to usage; 31% of customers signup to rewards programs because of the low effort required to do so, according to a recent study, while in a related study, Colloquy discovered that 81% of users continue to participate in loyalty programs if they’re easy to understand. In addition to making customers more loyal, rewards programs give retailers the opportunity to automate part of their retention marketing efforts. At Beans, we’ve created a simple, effective, and user-friendly rewards programs app made to fit any size.
Retailers need to be careful with their email marketing
Email is the king of marketing ROI; it offers $38 for every $1. However, retailers need to consider carefully the when and why of addressing their customers through email. The average person receives about 88 emails each day. This makes them selective about what they open, read and click, and unforgiving about what they unsubscribe from; the number one reason people unsubscribe from business emails is that they receive them too often. For sports retailers who correspond with the norm of a low purchase frequency, sending 4 or 5 emails to customers each month may not be a good idea. The point here isn’t to become some kind of overly polite Hugh Grant-style email marketer, but rather to choose the right strategy to optimize the chance of making sales. For example, retailers in the jewelry category, are unlikely to be able to afford to hang around; they need to be aggressive and start marketing to new customers early and often.